Sep 10, 2025
Eurex
Focus on VSTOXX® Derivatives | August 2025 recap
European markets were flat for the month, again lagging their US peers in August, with the STOXX® Europe 600 up 0.74%, EURO STOXX 50® up 0.6% but the DAX® down 0.68%.
With relatively flat equity index markets and many investors vacationing, European volatility was also flat for the month.
Skew inched higher over the month, suggesting increased demand for downside hedges ahead of the typically weak September period.
Implied correlation increased slightly over the month but remains quite subdued.
Equity Index Volatility
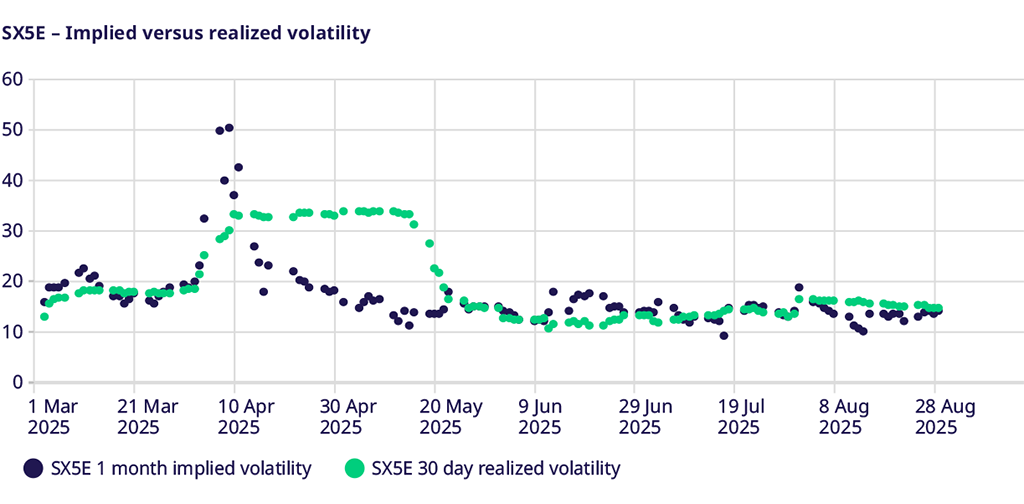
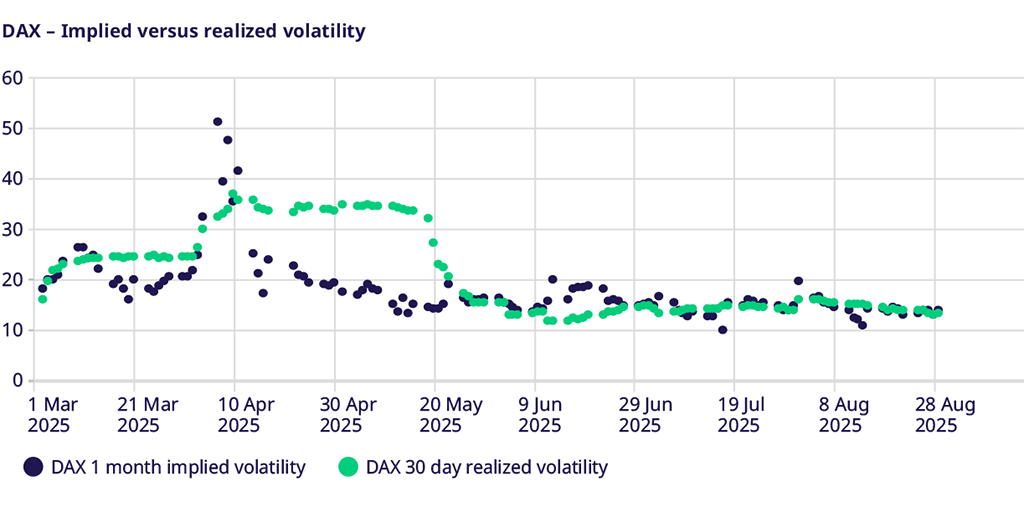
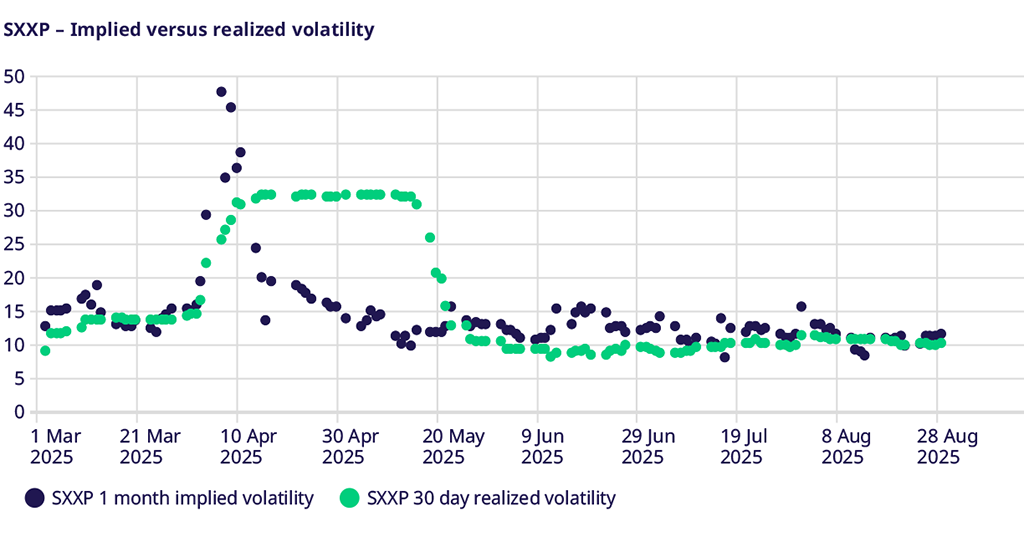
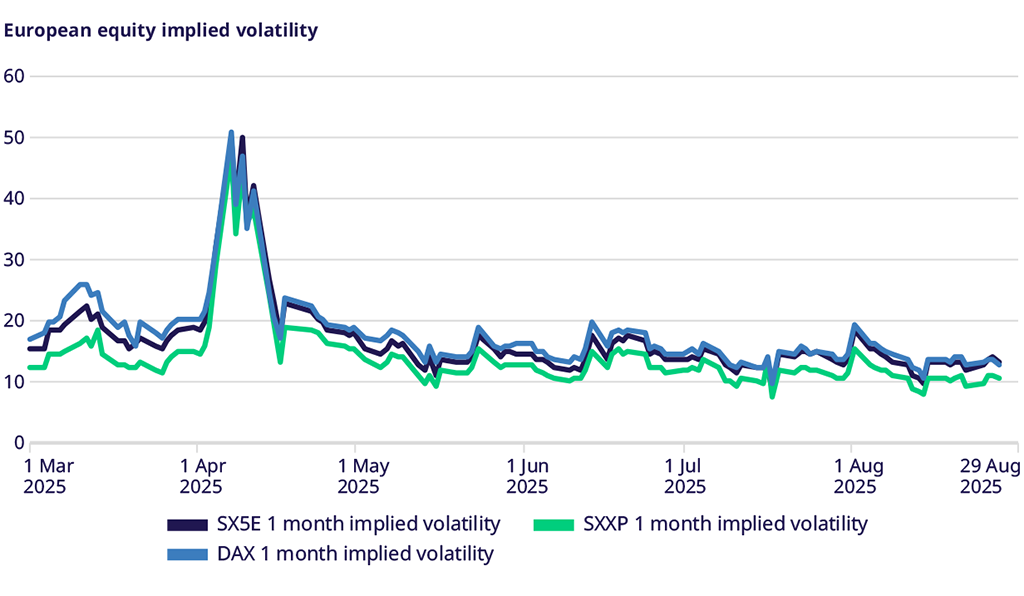
Overall, European stock markets were mostly flat, with the DAX down and the STOXX® Europe 600 up. Additionally, August tends to be quite slow, focusing on holidays and minimal portfolio adjustments, so it’s not surprising to see little movement in index volatility. STOXX® Europe 600 implied volatility stayed constant, moving from 13.89 to 13.92 over the month, while EURO STOXX 50® implied volatility declined from 11.34 at the end of July to 11.14 at the end of August. DAX® implied volatility dropped from 14.52 to 13.57 despite lower markets.
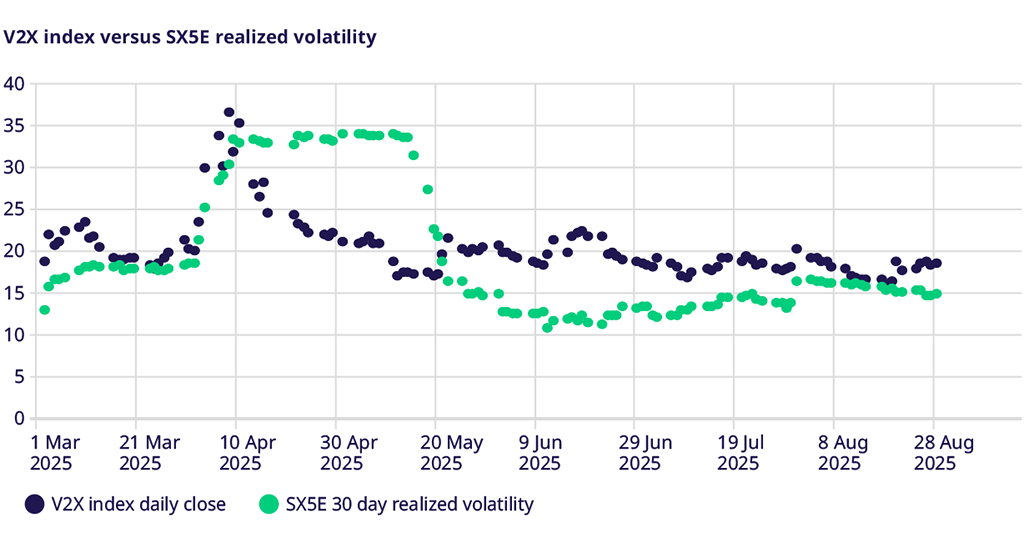
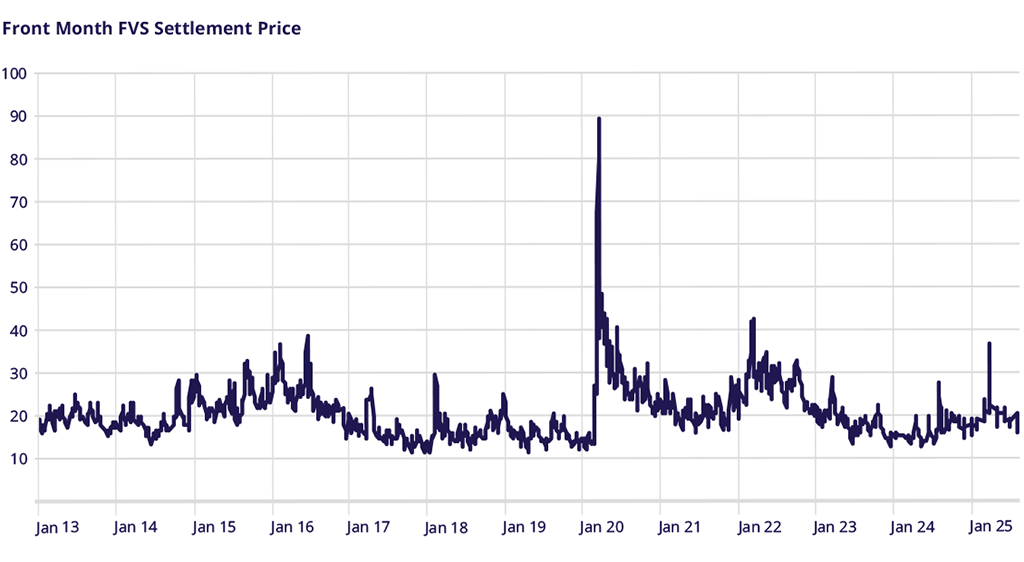
VSTOXX Index Performance
VSTOXX® moved slightly higher over the month from 17.85 to 18.35, maintaining a constant spread to 30-day realized volatility, which also moved higher over the month from 13.53 to 14.61. In addition, skew and kurtosis effects (out of the money relative to at-the-money) also added to the move in VSTOXX®, which we did not see in the benign at-the-money index volatility changes.
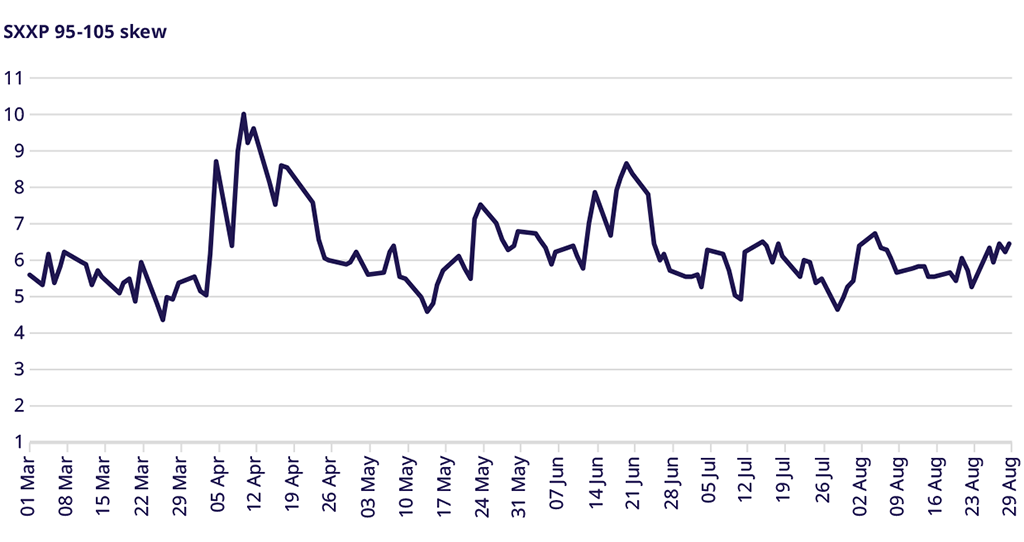
STOXX® Europe 600 Index Skew
It was not only a preference for out-of-the-money relative to at-the-money options where there was a change in August, but 95%-105% skew moved one volatility point higher from 5.43 to 6.46. Skew rising as the index moved slightly up suggests a relatively increased demand for downside options compared to upside options, potentially indicating a desire to hedge against downside risks in portfolios ahead of a seasonally weak September month.
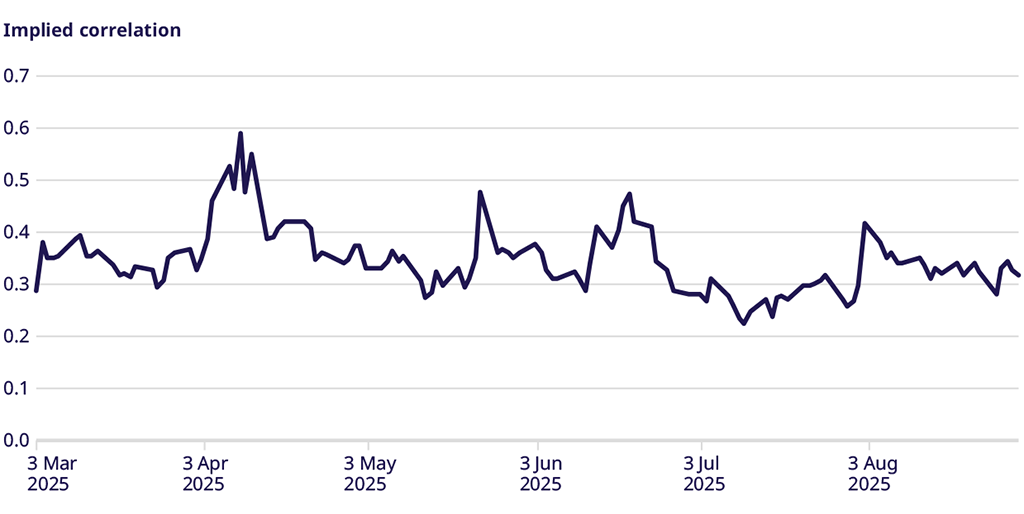
Correlation
Implied correlation moved slightly higher from 0.3 to 0.32. This is still much closer to the low of 0.22 in early July than the high of 0.6 seen in early April. This level of implied correlation is very average for what we have seen on a year-to-date basis, indicating it is still a ‘market of stocks’ and not yet a ‘stock market,’ the latter being more macro-driven.
Trade the European volatility benchmark
Explore this year's macro events and find an overview of dates.
VSTOXX 101: Understanding Europe’s Volatility Benchmark
Discover the latest STOXX whitepaper today to learn more about the VSTOXX® core methodology, historical performance analysis, and more.
For more information, please visit the website or contact: