Aug 15, 2025
Eurex
Focus on VSTOXX® Derivatives | July 2025 recap
European markets lagged their US peers in July. The SPX Index was up over 2% for the month, while the German DAX Index was up 65 basis points, the STOXX® Europe 600 was up 88 basis points, and the EURO STOXX 50® was up 31 basis points.
With relatively flat equity index markets, European volatility was also flat for the month, ending July very close to where it ended in June. Nevertheless, there was still a high-low range for the month that presented traders with opportunities.
Skew also stayed constant throughout the month and remains near its 6-month average.
Implied correlation dipped early in July but then rose steadily to finish the month slightly higher.
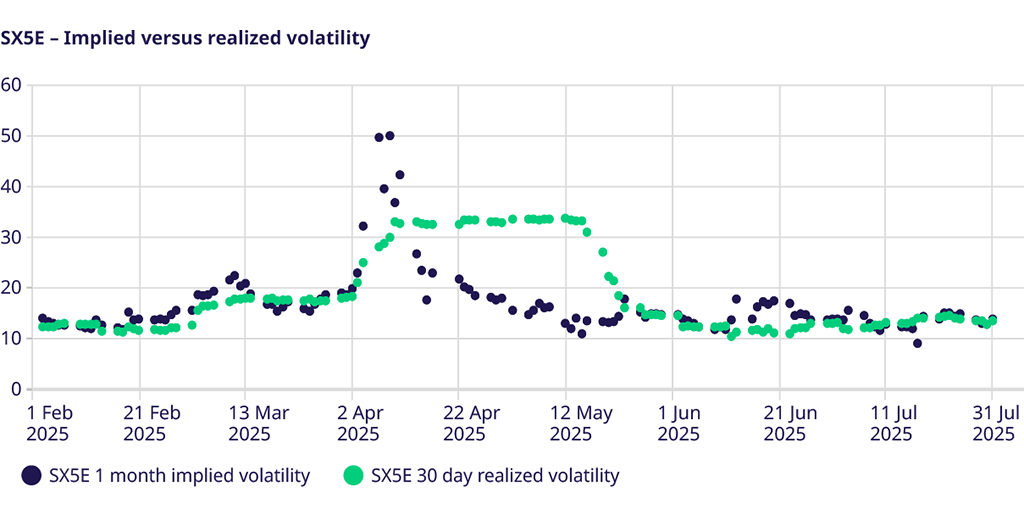
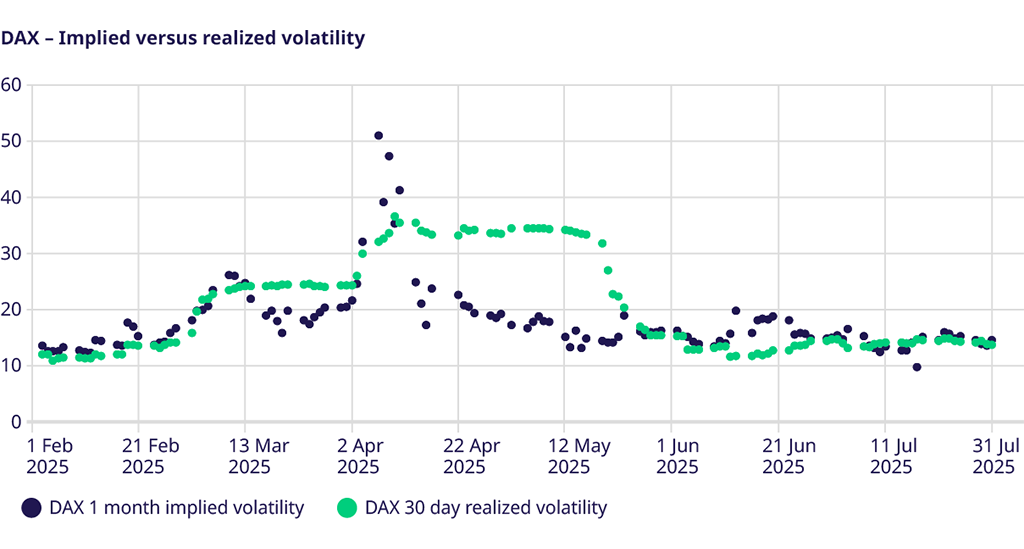
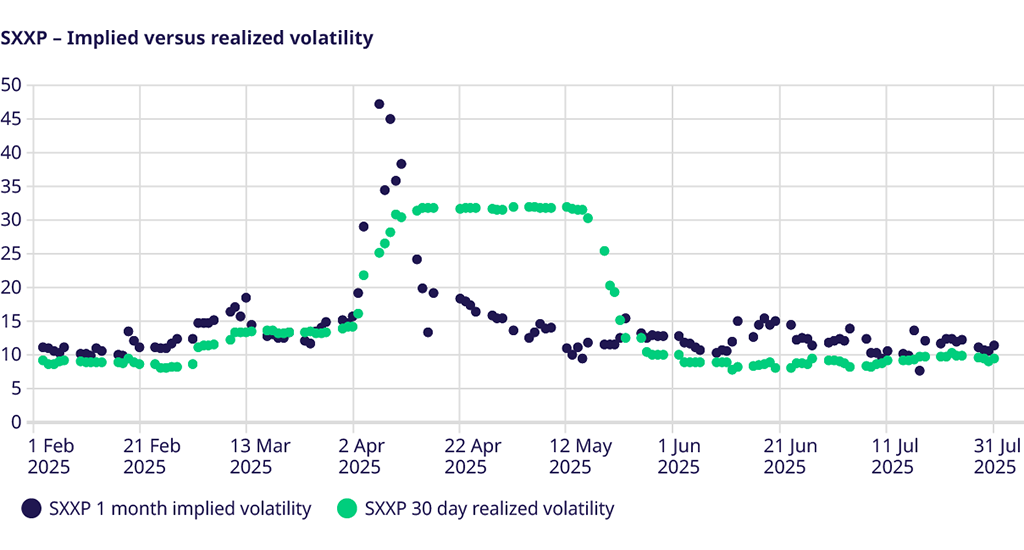
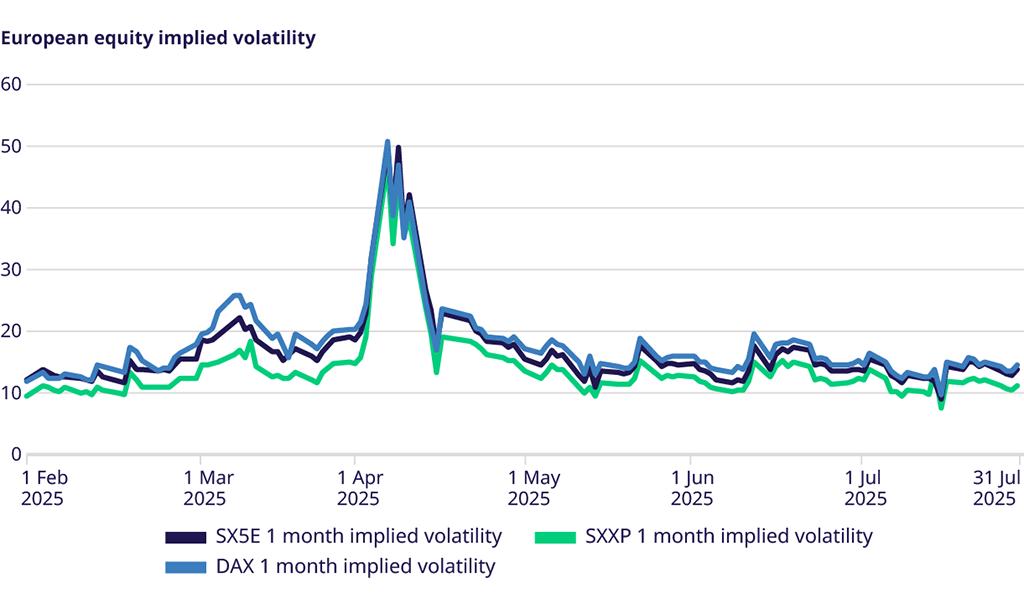
Equity Index Volatility
From the end of June to the end of July, equity implied volatility remained remarkably stable: SX5E implied volatility moved only slightly, from 13.66 on 30 June to 13.89 on 31 July. DAX implied fell from 11.78 to 11.34, and SXXP implied eased from 14.73 to 14.52. However, this doesn’t tell the full story. Intra-month, SX5E ranged from a high of 15.63 on 4 July to a low of 9.05 on 17 July. DAX saw a similar pattern, falling from 13.9 to 7.65 over the same period, while SXXP dropped from 16.45 to 9.75. Volatility rebounded from the mid-month lows ahead of the July expiration and ended the month essentially unchanged, despite the broad range seen in otherwise quiet markets.
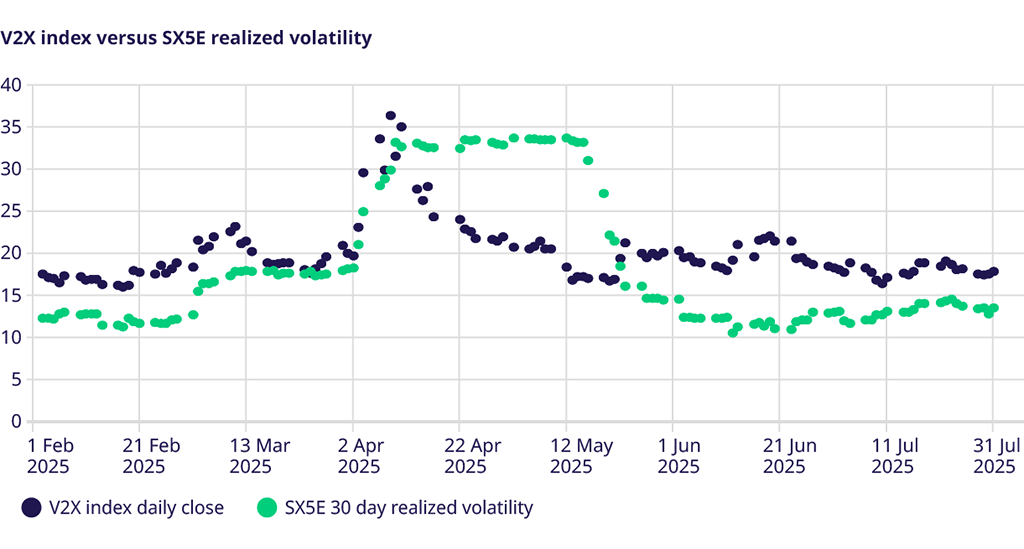
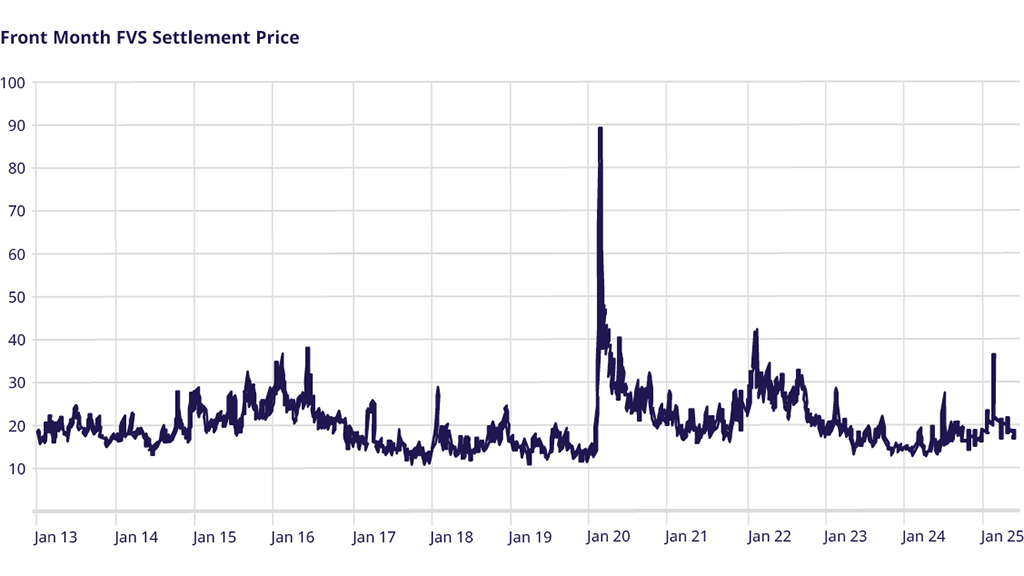
VSTOXX Index Performance
V2X futures were much more constant than the moves in 1-month implied volatility. V2X closes stayed within a 17.2 to 18.90 range and maintained a 4-5 volatility point premium to the SX5E realized volatility throughout the month.
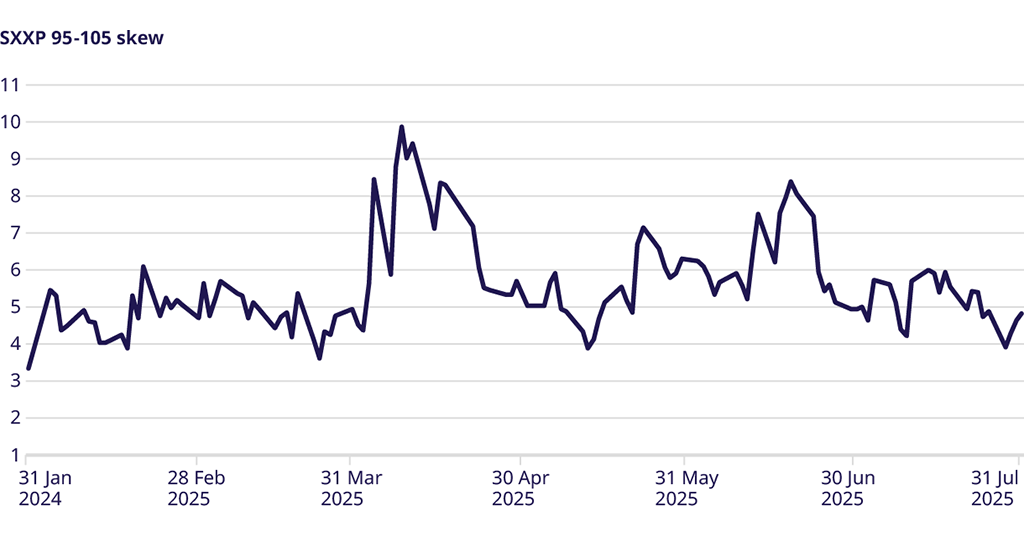
STOXX® Europe 600 Index Skew
The skew in implied volatility between the 95% puts and 105% calls remained in a narrow range from 4.6 to 6.5, with most of the month spent in the 5.5-6.0 volatility premium range. This aligns with the 6-month average of the series and suggests there is no significant supply or demand in either direction.
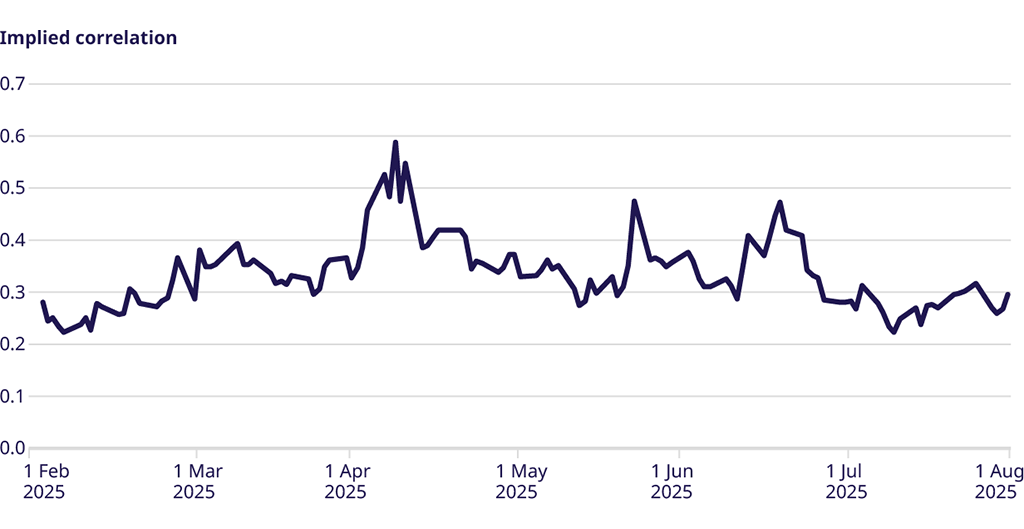
Correlation
Implied correlation dipped to 6-month lows of 0.2238 by 10 July, indicating that investors expect single stock movement to drive the index. By the end of the month, implied correlation rebounded to close at 0.2968, above the lows earlier in the month but remained well below the ‘macro’ peaks of 0.6 in April or 0.5 seen in both May and June.
Trade the European volatility benchmark
Explore this year's macro events and find an overview of dates.
VSTOXX 101: Understanding Europe’s Volatility Benchmark
Discover the latest STOXX whitepaper today to learn more about the VSTOXX® core methodology, historical performance analysis, and more.
For more information, please visit the website or contact: