Oct 09, 2025
Eurex
Focus on VSTOXX® Derivatives | September 2025 recap
- European markets were mixed for the month, with the DAX® struggling to a -0.2% while EURO STOXX 50® kept up with global markets at +3.33%. STOXX® Europe 600 ended in the positive but lagged at +1.5%.
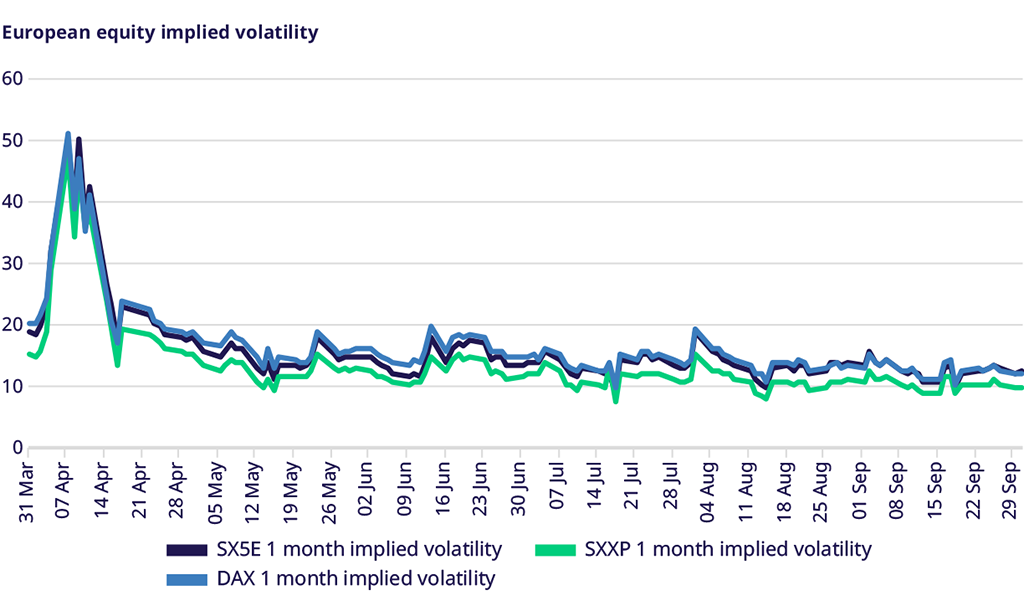
Although equity markets were mixed, implied volatility declined across the board, dropping between 1 and 1.5 points in the major indices.
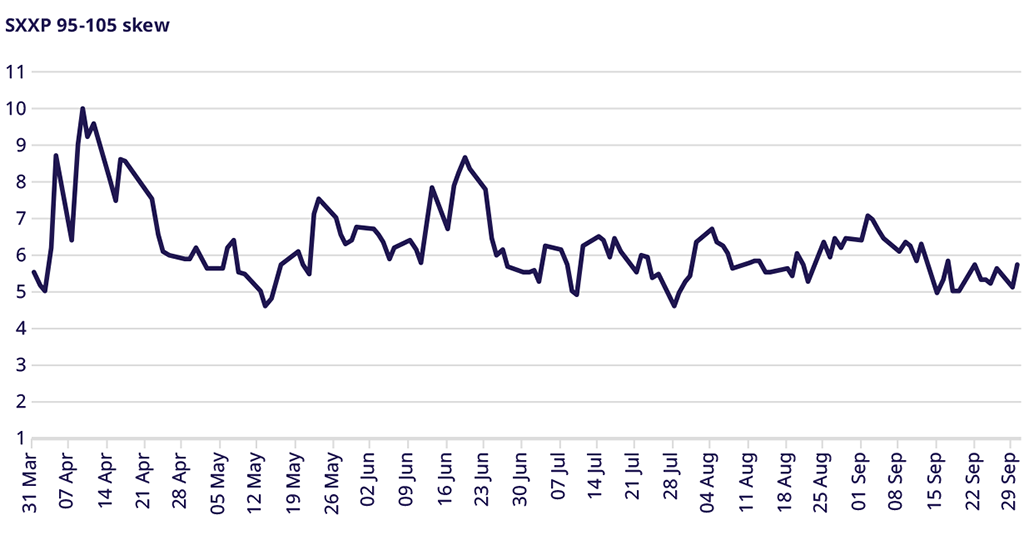
Skew remained steady during the first half of the month but decreased as markets climbed, settling about 0.75 vol points lower.
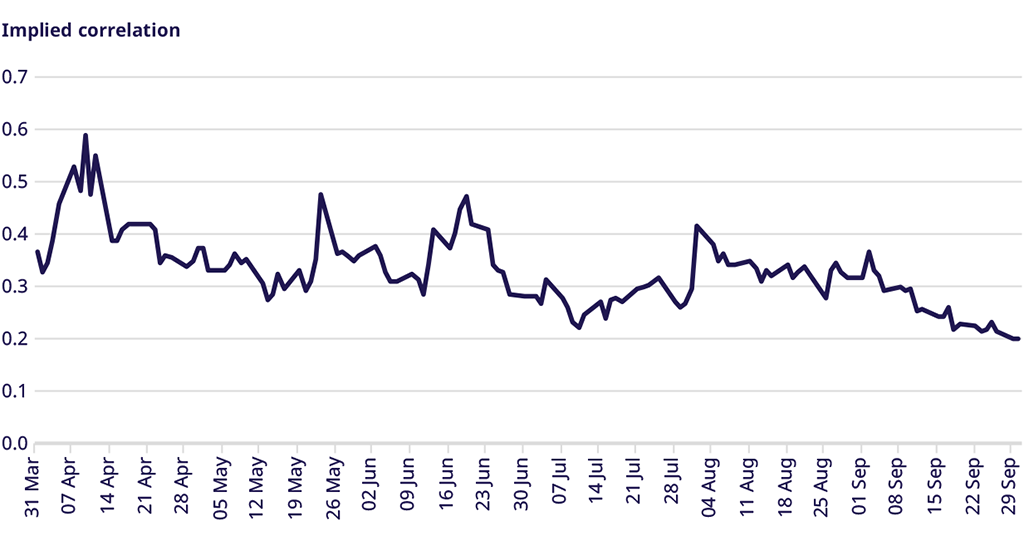
Implied correlation moved lower throughout September and ended the month at its lowest levels since January.
Equity Index Volatility
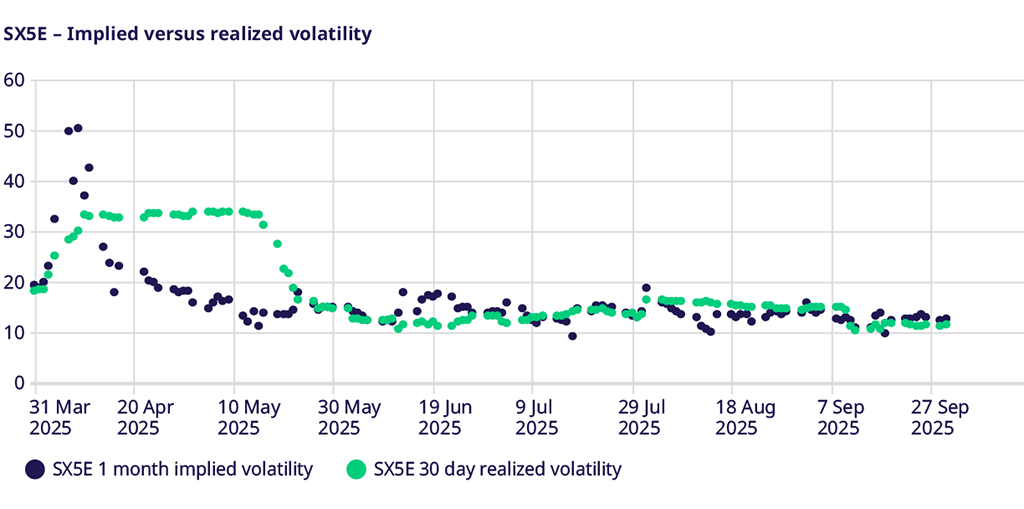
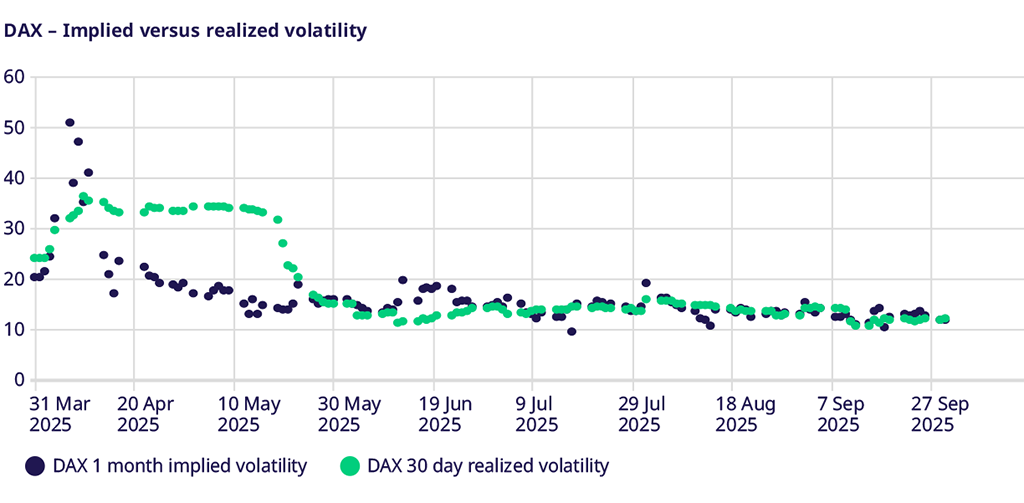
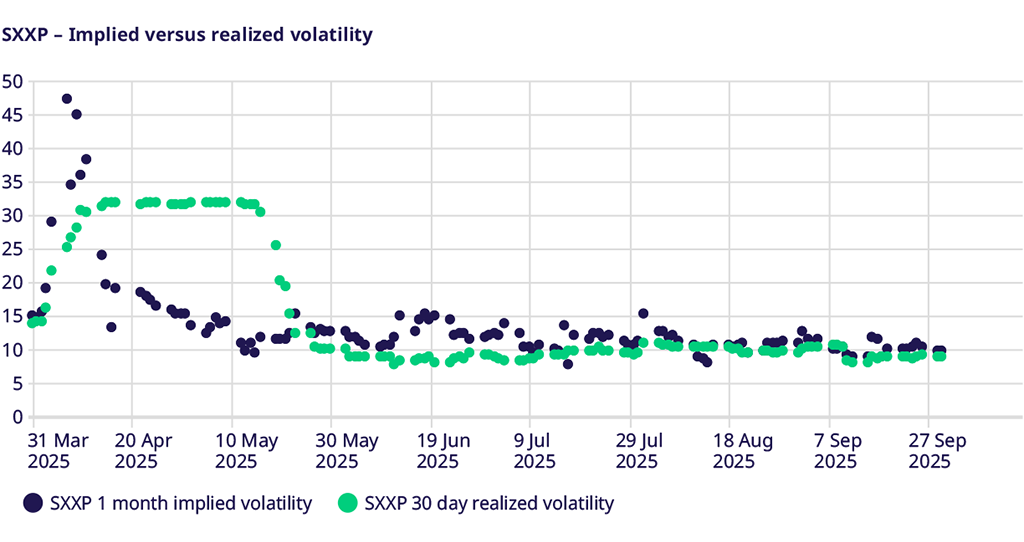
In EURO STOXX 50®, implied volatility fell from 13.92 to 12.42 in September, less than the move lower in realized volatility, which fell from 14.61 to 11.22. It wasn’t until the end of the month that the historical premium in implied to realized returned. In the DAX®, implied volatility fell from 13.57 to 12.01 and realized volatility similarly fell from 13.04 to 12.14, collapsing the premium of implied to realized. This premium remained in STOXX® Europe 600, but both implied and realized volatility fell from 11.14 to 9.94 and from 9.71 to 9.05 respectively.
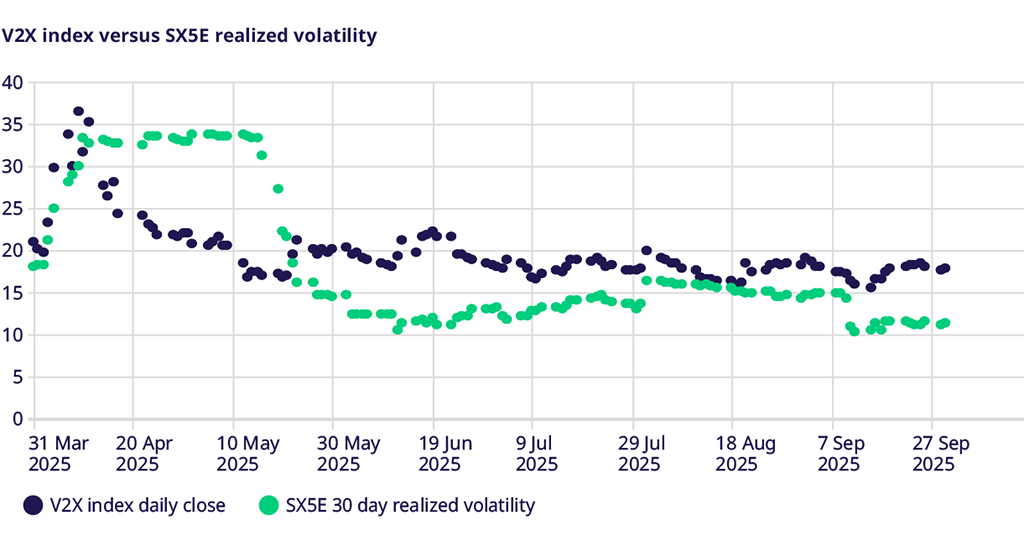
VSTOXX Index Performance
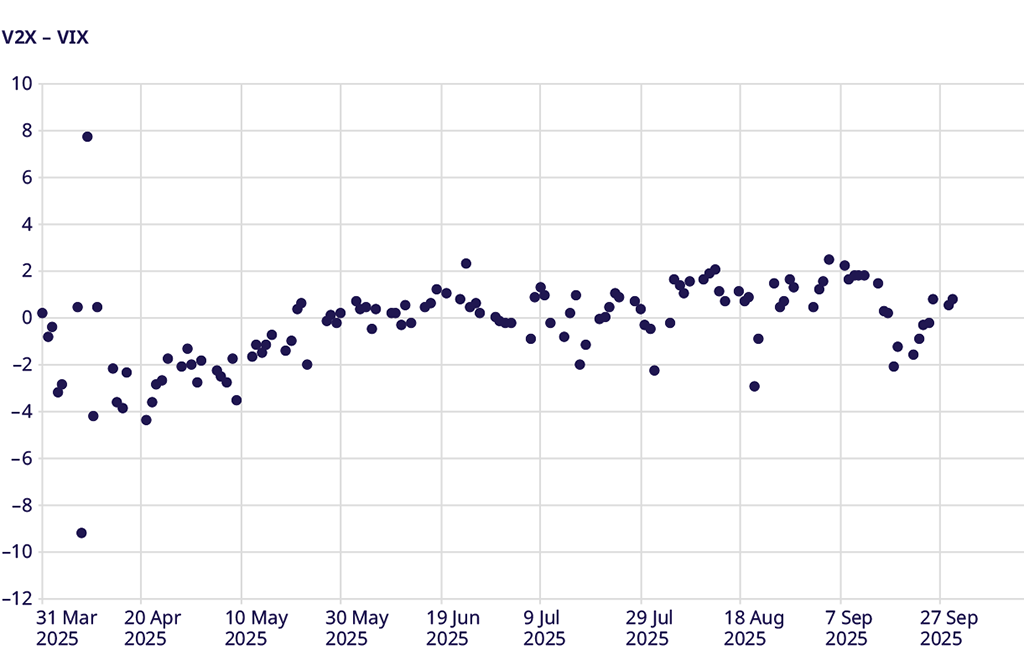
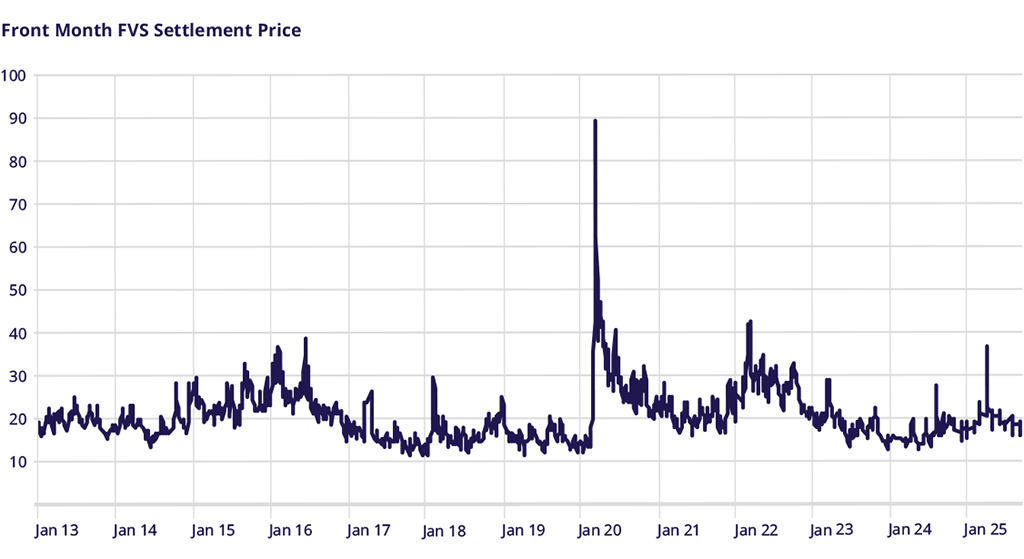
Although equity volatility fell over the course of the month, the decrease was less pronounced in the V2X Index. The front-month future dropped from 18.35 to 17.75. However, since realized volatility decreased from 14.61 to 11.22, a more significant move could have happened. Additionally, with at-the-money volatility falling more than the V2X, we can infer that traders valued the convexity of out-of-the-money options more, resulting in increased bids and supporting V2X relative to at-the-money implied and index realized volatility. The V2X vs. VIX spread stayed steady at about 1 vol point despite intramonth fluctuations.
STOXX® Europe 600 Index Skew
Skew decreased over the month from 6.46 to 5.75 but still remains well within the average range. Given that equity markets rose for the month, it’s not surprising to see a slight fall in equity skew; however, it does indicate some nervousness in the options market.
Correlation
Implied correlation fell over the month from .31 to .20, reaching the lowest level seen since January. As earnings season nears in October, a market focus on single names and not index volatility makes sense, driving implied correlation lower.
Trade the European volatility benchmark
Explore this year's macro events and find an overview of dates.
VSTOXX 101: Understanding Europe’s Volatility Benchmark
Discover the latest STOXX whitepaper today to learn more about the VSTOXX® core methodology, historical performance analysis, and more.
For more information, please visit the website or contact: